CIECC Training · Technology economics
Deploying energy technologies: Wright's law, LCOE and the cost of capital
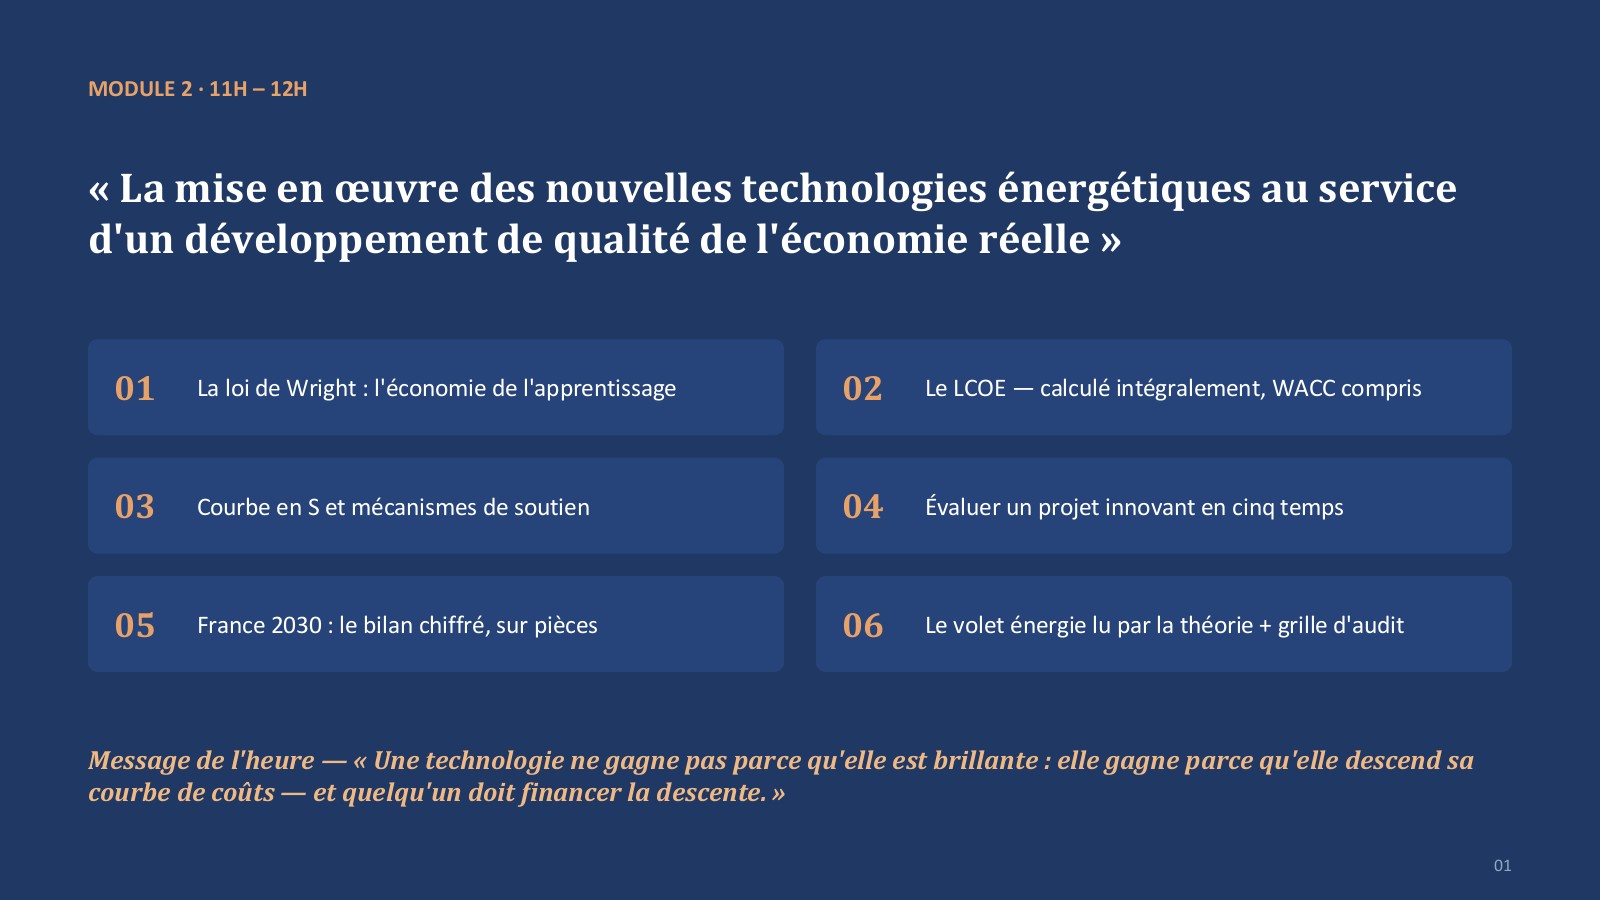
A technology does not win because it is better. It wins because its cost curve comes down, and because someone finances that descent.
How an expensive technology becomes competitive
This second module of 17 July 2026, in the CIECC training at IEAM Paris, opens up the engine. The previous module set the institutional scene: instruments, mission, trajectory. This one covers the economic mechanics of cost reduction, and above all how to verify it on a real project.
Two laws structure the demonstration. Wright, under whom costs fall with cumulative production. Rogers, under whom adoption follows an S-curve.
Wright's law: learning by producing
With each doubling of cumulative production, unit cost falls by a constant percentage called the learning rate. The series published by the International Renewable Energy Agency document the collapse of solar costs over two decades, a textbook case of the mechanism.
Three strategic consequences follow. The advantage of the first mass deployer, which comes down the curve ahead of the others and then sells the world costs no one can match. The economic justification for temporary support, since deployment produces learning. And the lasting asymmetry between countries that results.
The limit was addressed honestly: Wright's law applies to products manufactured in long production runs, photovoltaics, batteries, electrolysers. It applies poorly to large one-off structures, where standardisation is low and learning effects slower.
LCOE and the variable that really decides
The levelised cost of energy provides a common language: full discounted costs divided by discounted output, a single figure in euros per megawatt hour.
The exercise worked through on the board covered one megawatt-peak of solar, calculated in full, including the annuity factor over twenty-five years. The most important result is not the final figure but its sensitivity: moving from a weighted average cost of capital (WACC) of 3% to 8% raises the megawatt hour by around 47%, with strictly identical technology. The cost of capital is the dominant variable, which closes the loop with the regulatory visibility covered in the previous module.
The limits of LCOE were set out. A megawatt hour produced at one in the afternoon in June is not worth a megawatt hour produced at seven in the evening in January. And grid, flexibility, storage and back-up capacity costs are paid by the system, without appearing in the LCOE of a single installation.
S-curve and pull instruments
Diffusion follows an S-curve, from innovators to laggards. The critical moment is the transition to the early majority: that is where public support must hand over to the market.
Five pull mechanisms were compared, from guaranteed feed-in tariffs to auctions. The resulting golden rule is twofold: good support is degressive, aligned with the Wright curve, because constant support on a falling curve manufactures rent. And good support is revealing: auctions make industrial players state their real costs, which spares the State from guessing them.
Appraising an innovative project in five steps
The proposed methodology requires proving the real maturity level of every critical building block through third parties, then building a multi-dimensional business case, before any commitment.
The field experience brought to the discussion was direct: seen from major transition projects, subsea, offshore and hydrogen, high-quality development starts with a signed cost-schedule-scope baseline, then defended over time.
France 2030 on the evidence
The running case was covered with the figures from the official April 2025 review, supplemented by an independent study from October 2025. Around €39 billion committed against an announced envelope of €54 billion, an October 2025 milestone at around €40 billion, around 7,500 projects supported and more than 7,000 unique beneficiaries, 150,000 jobs created or mobilised rising to around 156,000 in October 2025, around 6,000 patents generated, 14 indicators out of 16 on track or ahead, and €10 billion directed towards breakthrough technologies.
The doctrine was tested against the actual structure of the award recipients. First test, emerging players: 55% of beneficiaries are small and medium-sized enterprises, mid-caps and micro-enterprises, 28% are public research and training bodies, 17% are large companies. Second test, the regions: 48% of funds go to sponsors located in regions outside Île-de-France.
One point of vocabulary was imposed, because it determines the honesty of the review. Announced, committed and disbursed designate three distinct realities: a political envelope, an amount contracted with award recipients, and money actually paid out against milestones achieved.
Placing every figure on the curves
The transferable exercise of the module consists of taking a programme review and placing each line on the curves. Electrolysis, with 0.4 GW installed and 0.8 GW under construction, is crossing the industrial valley of death and remains the most contested bet. The 640,000 electric vehicles produced at end 2024 for around €3.7 billion, against a target of around two million, are coming out of the early phase of an S-curve whose inflection is still to be confirmed, with pull provided by dated European standards. Industrial decarbonisation, with 7.2 megatonnes of CO₂ avoided against 11 targeted for 368 projects and €1.5 billion, illustrates direct pull where the State buys avoided tonnes.
The final deliverable of the module is a ten-question audit checklist to run before committing a single euro, the first being: is the problem stated before the technology, alternatives included.